Dear Fellow Shareholders,
We are pleased to provide you with the Third Avenue International Real Estate Value Fund’s (the “Fund”) report for the quarter and year ended December 31, 2024. During the period, the Fund generated a return of –12.09% (after fees) compared to the most relevant benchmark, the FTSE EPRA/ NAREIT Global ex U.S. Index 1 (the “Index”), which returned -14.57% (before fees) for the same period. During the calendar year, the Fund generated a return of -5.67% (after fees) versus -7.04% (before fees) for the Index.
PERFORMANCE AND EXCESS RETURN (As of December 31, 2024)
|
Annualized |
||||||
|
3 Mo |
Yr |
Yr |
Yr |
Yr |
Inception* |
|
|
Third Ave Int’l Real Estate Value Fund (MUTF:REIFX) |
-12.09% |
-5.67% |
-4.23% |
1.83% |
4.53% |
4.29% |
|
FTSE EPRA/NAREIT Global ex US Index 1 |
-14.57% |
-7.04% |
-8.59% |
-6.17% |
0.32% |
0.83% |
|
Third Ave Int’l Real Estate Value Fund Excess Return 2 |
2.48% |
1.37% |
4.36% |
8.00% |
4.21% |
3.46% |
|
As of December 31, 2024 *Inception Date 3/19/2014. Source: Third Avenue Management, Company Reports, Bloomberg. |
OBSERVATIONS
Currency fluctuations posed a challenge over the year with the appreciation in the U.S. dollar having a negative -6.5% impact on the Fund’s performance. In terms of local currency, the Fund would have returned approximately +1% for the year. Notably, Asian investments delivered attractive returns, with Hong Kong outperforming its benchmark by 24%, and Japan outperforming by 17%. Residential investments in undersupplied housing markets in Europe (Dublin & Madrid) were also a source of outperformance. However, overall weakness in the Fund’s British, Canadian, and Latin American-based investments offset these positive returns.
With another year of solid cash flow growth and weak share price returns, the Fund’s average price-to-earnings multiple ended the year at 13 times –the lowest, or most attractive, in the Fund’s 10+ year history. For reference, this compares to the March 2020 COVID drawdown when the multiple was 15 times. Similarly, using conservative estimates of private market real estate value to calculate net asset value (“NAV”), the Fund trades at a ratio of 0.66 times, also the most attractive ratio over the past 10 years. Despite these discounted multiples, the outlook for earnings and NAV growth remains attractive in our opinion. As described in the commentary section of this letter, while volatility in interest rates and strength in the U.S. dollar have been negatives for the share price performance, Fund Management remains confident in the outlook for the Fund’s investments, and as such, Fund Management recently added to several existing holdings in the Fund including self-storage groups Big Yellow (OTCPK:BYLOF, UK), StorageVault (OTCPK:SVAUF, Canada) and Shurgard (OTCPK:SSSAF, Europe), datacenter special situation Merlin Properties (OTCPK:MRPRF, Spain), European nearshoring exposed CTPNV, and Singaporean integrated resort operator Genting (OTCPK:GIGNF).
ACTIVITY
The Fund’s recent positive experience with European residential investments was attributable to a focus on local markets with appealing underlying residential fundamentals, namely a significant undersupply of adequate housing relative to elevated demand from urban employment and population growth. Throughout 2024, this supply and demand combination boosted share prices of the Fund’s investment in Irish homebuilder Glenveagh Properties (OTCPK:GLVHF, “Glenveagh”) and Spanish homebuilder Aedas Homes. Particularly for Dublin, Ireland-based Glenveagh, the backdrop remains positive, with home prices growing and the creation of efficiencies through scale and stabilizing costs resulting in higher operating margins and profitability. Glenveagh recently guided to 15% earnings per share growth in 2025.
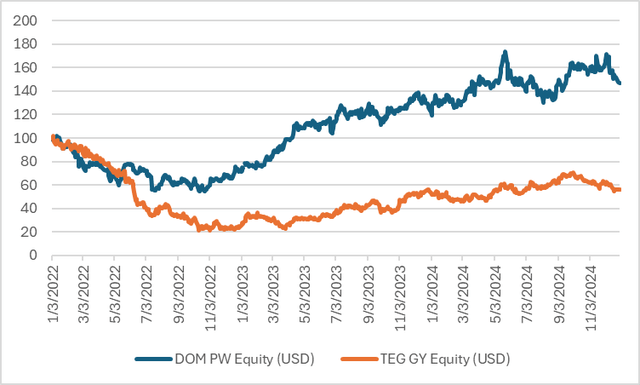
Like Ireland, the Polish economy has experienced high economic growth through the combination of (i) a desirable corporate tax regime and (ii) a pro-business regulatory environment that drives foreign investment and boosts services sector export growth. Poland’s rapid productivity and GDP growth per capita since joining the EU in 2004 saw the country classified as a ‘developed market’ by 2018, less than 30 years after the fall of communism. Notably though, Poland’s key urban areas have inadequate quality housing stock with limited availability and strong demand due to ongoing urbanization, immigration, and income growth. In fact, much of the nation’s housing is viewed as lower quality, having been constructed using inefficient industrialized methods during 1945-1989—with the majority being constructed during the communist era. These factors have led to significant demand for modern accommodations, as well as the growth in house prices that has been reflected in publicly listed homebuilder DOM Development (“DOM” – not owned by the Fund), which has achieved compounding annual shareholder returns of 26% per year over the last three years (in USD) by providing much-needed new supply.
Historically, homebuilders such as DOM Development have volatile earnings streams given their high operational leverage and the cyclicality of residential real estate. As such, Fund Management typically limits exposure and only invests in homebuilders with long-term positive supply/demand fundamentals, impressive management teams, and very well capitalized entities with low levels of net debt (if any), such as is the case with Glenveagh. The potentially volatile homebuilding earnings streams differ from those of German rental housing portfolios, an asset type with highly resilient cashflows in various economic circumstances given occupancy is sticky, regulated rents grow in the low single digits, and rents below “market” levels limit new construction.
Within this context, Fund Management initiated a position in German residential owner, manager, and developer TAG Immobilien (OTCPK:TAGOF, “TAG”) during the quarter. Not only does TAG own a portfolio of over 83,000 rental units around Germany, but it also owns 3,000 rental units in Poland together with one of Poland’s largest home builders through its subsidiary ROBYG. TAG is astutely using the Polish homebuilding subsidiary’s profits to build its Polish rental portfolio to around 10,000 units over the next 4 years, offering an attractive value creation story to complement its resilient German rental portfolio. Importantly, and like its open economy, Poland’s rental markets are dynamic with free market characteristics.
DOM VERUS TAG SHARE PRICE 3
Source: TAM, Bloomberg
At the current share price, despite having a homebuilding business similar to DOM’s, none of TAG’s Polish potential seems to be priced in the stock. In fact, the implied value of TAG’s German residential units on a standalone basis (when ascribing no value to the Polish business) is just U.S.$66,000 per unit—much lower than replacement costs.
These abnormal levels of valuation disconnect compared to private market values are now standard across the U.K. and Europe, although not as extreme (attractive) as the discounts on offer in many Asian property companies. While a lot of Asia’s discount is explained merely by weak overall market sentiment, one of the impediments to shareholder returns in Asian property companies listed in Hong Kong, Singapore, and Japan has historically been weaknesses in corporate governance. Listed companies own some of the best assets in the region, are well-capitalized (low debt levels), and well managed. However, they have done little to align management with minority shareholders and focus on shareholder value creation. The fix seems simple though: improve communication, simplify by divesting non-core assets, and improve capital allocation, favoring shareholder returns through value-additive strategies like buying back shares at deep discounts.
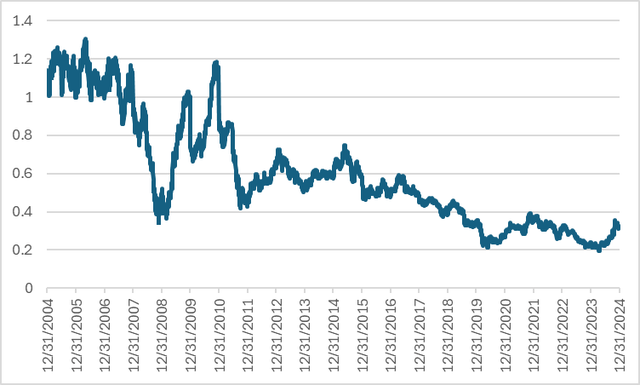
Pleasingly, there is growing evidence of improvement, specifically in Japan (as mentioned in this previous letter and increasingly in Hong Kong and Singapore. The Fund has directly benefited from this shift, as highlighted by the outperformance in Japan and Hong Kong in 2024, via investments that are actively improving capital allocation and growing net asset value (e.g., Swire Pacific, SUNeVision Holdings, et al.). However, much remains to be done, with the starkest example being the listed Hong Kong property companies that trade at just 37% of the value of their real estate on average. 4
With the region’s deep valuation discounts and significant potential upside, Fund Management initiated a position in diversified property company Hong Kong Land Holdings Ltd. (OTCPK:HKHGF, “HKL”) upon HKL’s announcement of a dramatic strategy change during the quarter. Fund Management believes HKL’s new strategy could create significant value for shareholders and help close at least some of the extreme discounts that shares trade relative to private market values.
HKL 20-YEAR PRICE TO BOOK RATIO
Source: TAM, Bloomberg
As background, HKL is a subsidiary of Jardine Matheson (OTCPK:JMHLY), which has been run by the Keswick family for five generations. HKL owns and operates premium mixed-use commercial real estate with key assets in Hong Kong, Singapore, and Shanghai. Its most dominant position is in Hong Kong’s aptly named “Central” district with over 4.8 million square feet (about half the total floor space of the Pentagon) of office and luxury retail properties. Highlighting the unique value of this real estate, various European luxury retail brands recently committed U.S.$600mn of their own capital to revitalize and expand their global flagship stores in HKL’s Central portfolio (i.e., Hermes, Louis Vuitton, Tiffany & Co, Chanel, Sotheby’s, et al). This comes with a very well capitalized balance sheet with A and A3 credit ratings.
As part of the strategic shift, HKL has proposed several initiatives, including: (i) simplifying and refocusing the company on high barrier to entry mixed-use real estate in Asian Gateway cities; (ii) improving alignment with management remuneration linked to shareholder returns and the execution of the strategy; (iii) enhancing board composition; (iv) committing to actively divest U.S. $10bn of real estate; (v) proposing a buyback of about 20% of the current market cap; and (vi) expanding cash flow growth and capital efficiency by using third party capital and establishing a fund management platform with a target of U.S.$100bn of assets under management within 10 years.
As a result of the strategic shift, HKL now targets earnings and dividend growth of more than 7% per year (over the next 10 years), as well as a dividend yield gradually doubling from 5% to 10% over that period (based on today’s share price). Assuming constant multiples, Fund Management estimates such an outcome would deliver shareholders a “mid-teens” annual return—with the potential for a greater return if the multiple expands from the current modest level.
However, the potential for compounding earnings and NAV is not restricted to those involved in restructurings such as HKL. In this regard, Fund Management was pleased to see the Fund’s long-term holding Corp Inmobiliaria Vesta (VTMX, “Vesta”) announce a new five-year plan at its November investor day. The Mexican industrial owner and developer is targeting annual earnings growth of approximately 10% per year over the plan period. This growth rate is a function of increasing rents and higher occupancy levels, together with considerable development completions at attractive yields in an environment of ongoing “nearshoring” demand. While some uncertainty remains on potential tariffs, it seems likely that threats will be negotiated away given Mexico’s significance in delivering the new U.S. administration’s desires for lower immigration. Fund Management’s view remains that Mexico is a crucial component of the U.S.’s reshoring ambitions, given its lower labor costs, trained workforce, and already integrated supply chains.
Another significant development during the quarter related to ESR Group (OTC:ESRCF, “ESR”), a pan-Asia logistics and data center manager and developer held by the Fund as it received a long-awaited privatization offer from a consortium of U.S. private equity groups led by Starwood Capital. In Fund Management’s opinion, the offer price of HK$13 per share seems opportunistic, and at a discount to the “low end” of our valuation range, with implied multiples well below recent transactions. Furthermore, Fund Management believes there is significant long-term upside in holding ESR and that shareholders would be better off if management pursued alternative value creation strategies—such as spinning out and listing the Australian business or simply continuing the streamlining and simplification of the business. With that being the case, Fund Management will continue to closely monitor the related developments leading up to the shareholder vote.
POSITIONING
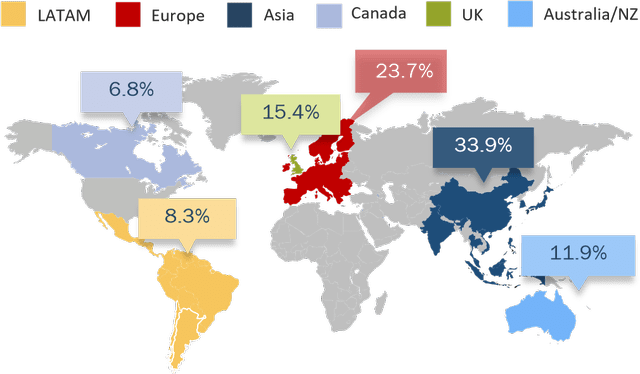
Following the additions of TAG and HKL, the following chart shows the Fund’s diverse regional exposure. The Asian exposure remains broadly consistent with the prior quarter at 33% of the Fund’s assets, while the U.K. exposure has increased slightly alongside a reduction in Latin America exposure.
DIVERSE REGIONAL EXPOSURE* As of December 31, 2024
Source: Bloomberg, TAM
* Third Avenue International Real Estate Value Geographic exposure at 12/31/2024 Regional exposure reflects where the company is listed.
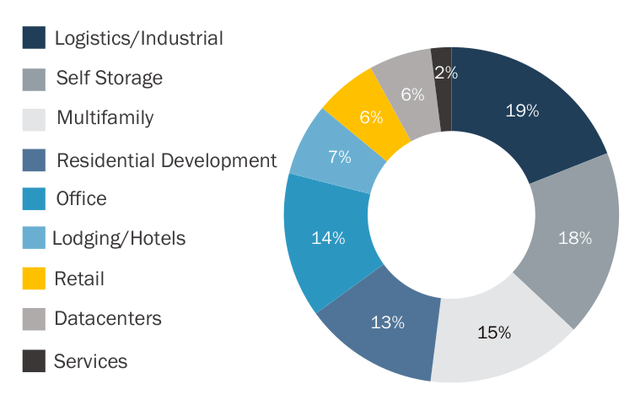
Regarding asset types, residential, industrial/logistics, and self-storage real estate continue to make up most of the Fund’s exposure, with just under two-thirds of Fund capital deployed in these asset types. In addition, exposure to the traditional commercial real estate asset types of retail and office comprise 20% of the Fund, lower than the Index exposure of 49%, while specialized assets like lodging and data centers make up 13% of the Fund.
CURRENT ASSET TYPES As of December 31, 2024
| Source: Company Reports, Bloomberg
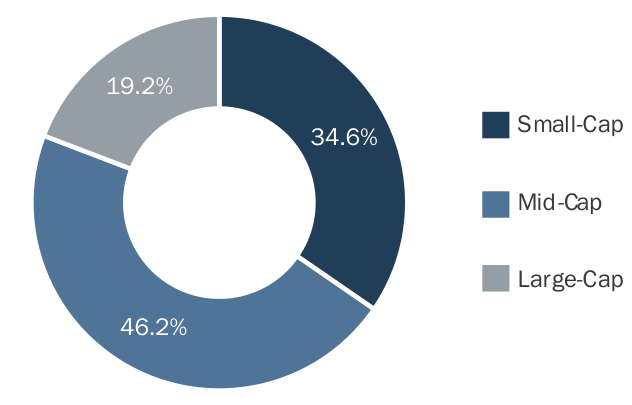
Given the Fund’s exposure to companies focused on individual property types in select geographic markets, the holdings tend to have more “specialized” portfolios than some of the larger constituents of the Index. As a result, the Fund’s holdings are often characterized as small- and mid-market cap companies as illustrated below.
CURRENT MARKET CAP WEIGHTINGS 5
As of December 31, 2024 | Source: Factset, Company Reports
FUND COMMENTARY
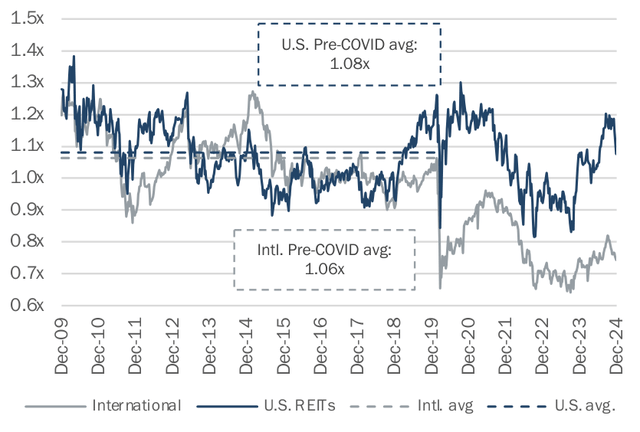
Before the commencement of the various COVID-related lockdowns in early 2020, the international listed real estate sector tended to trade around book value, like the U.S. Real Estate Investment Trust (“REIT”) sector, as shown in the following chart.
PRICE TO BOOK RATIO 6 LISTED INTERNATIONAL AND U.S. REAL ESTATE 7
Source: Bloomberg, Third Avenue Management., Daiwa Research, Green
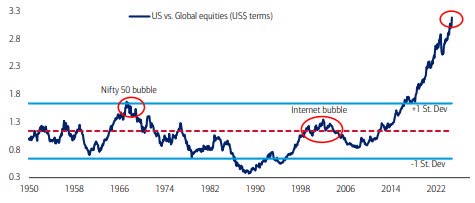
However, following COVID, international listed real estate valuations have struggled to recover to their pre-COVID levels, while the U.S. REITs now trade above prior averages. Eventually, Fund Management contends that a “reversion to the mean” could drive 40% upside for the overall international real estate sector. This phenomenon is not restricted to the listed real estate sector, however, as broad international equities underperformance relative to the U.S. has been unprecedented over the past 75 years, as shown in the following chart.
75-YEAR HIGH IN U.S. STOCKS VERSUS INTERNATIONAL
Source: Bank of America (“BofA”) Global Investment Strategy
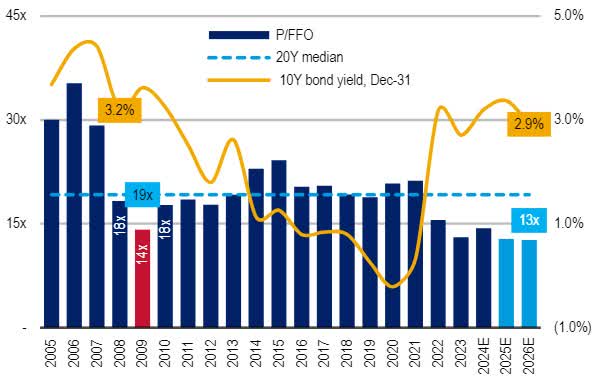
Even more confounding: such a re-rating has occurred in an environment where international real estate earnings have been increasing, thus leaving earnings multiples at historically attractive levels. While such valuations had been common across Asian property companies as mentioned previously, discounted multiples are no longer restricted to Asia but present across most regions. This is further demonstrated in the following chart presenting the earnings multiples of the U.K. and European listed real estate sector, where valuations have not been this “cheap” over the past 20 years, including the 2009 Global Financial Crisis.
U.K./EURO LISTED REAL ESTATE EARNINGS MULTIPLES 8
Source: BofA Global Research Estimates.
These attractive multiples are mirrored in the Fund, with the 13x earnings multiple as the cheapest in its 10-year history. Often, low multiples reflect low growth, but this is not the case for the Fund’s investments. This is best illustrated by the fact that the Fund’s top 10 investments, representing more than half of the Fund, have delivered 12% compounding earnings per year growth over the past five years. Importantly, this uses pre-COVID 2019 earnings as a base and includes the associated negative earnings impact from COVID lockdowns.
Fund Management’s underwriting suggests that attractive levels of earnings per share growth should continue. This view is supported by many of the Fund’s investments, which have recently issued 2025 or longer-term guidance as part of strategic plans, as is the case with HKL and Vesta.
Further supporting this view, most of the Fund’s investments operate in markets with limited competition from new supply and many cases of pricing power. As such, rental rates, on average, are expected to continue growing at attractive levels. This top-line rental growth is supported by Fund investments that are retaining a significant portion of earnings (Fund average payout ratio of free cash flow is <50%), and retained cash is being used for value creation such as (i) developing investment properties with a high return on capital (mostly self-storage, industrial and datacenters), (ii) buying back shares at discounts to intrinsic value (homebuilders and Asian diversified), and (iii) reinvesting in asset acquisitions where economies of scale exist (self-storage).
From Fund Management’s perspective, the ability for the underlying Fund investments to compound earnings and value over time is disconnected from the low (attractive) earnings multiples and discounts to NAV currently offered. If this persists, an uptick in privatizations at high premiums could result. Together with the Fund’s invigorating new investments and positive recent company guidance, we remain constructive on the outlook for the Fund.
We thank you for your continued support and look forward to writing to you again next quarter. In the meantime, please don’t hesitate to contact us with any questions or comments at [email protected].
Sincerely, The Third Avenue Real Estate Value Team
Quentin Velleley, CFA Portfolio Manager
 As of March 1, 2024 REIFX Gross/Net Expense Ratio: 1.62%/1.00%, REIZX Gross/Net Expense Ratio: 1.54%/1.00% The Advisor has contractually agreed, for a period of one year from the date of the Prospectus, dated March 1, 2024, to waive advisory fees and/or reimburse Fund expenses in order to limit Net Annual Fund Operating Expenses (exclusive of taxes, interest, brokerage commissions, acquired fund fees and expenses, dividend and interest expense on short sales and extraordinary expenses) to 1.00% of the average daily net assets of the Institutional Class and Z Class (the “Expense Limitation Agreement”). The Expense Limitation Agreement may be terminated only by the Board of Trustees of Third Avenue Trust. If fee waivers had not been made, returns would have been lower than reported. Past performance is no guarantee of future results; returns include reinvestment of all distributions. The chart represents past performance and current performance may be lower or higher than performance quoted above. Investment return and principal value fluctuate so that an investor’s shares, when redeemed, may be worth more or less than the original cost. For the most recent month-end performance, please call 800-443-1021. TOP TEN HOLDINGS
Allocations are subject to change without notice The fund’s investment objectives, risks, charges, and expenses must be considered carefully before investing. The prospectus contains this and other important information about the investment company, and it may be obtained by calling 800-4431021 or visiting Third Avenue Management | Pioneers in Value Investing Since 1986. Read it carefully before investing. Distributor of Third Avenue Funds: Foreside Fund Services, LLC. Third Avenue offers multiple investment solutions with unique exposures and return profiles. Our core strategies are currently available through ’40Act mutual funds and customized accounts. If you would like further information, please contact a Relationship Manager at: IMPORTANT INFORMATION This publication does not constitute an offer or solicitation of any transaction in any securities. Any recommendation contained herein may not be suitable for all investors. Information contained in this publication has been obtained from sources we believe to be reliable, but cannot be guaranteed. The information in this portfolio manager letter represents the opinions of the portfolio manager(s) and is not intended to be a forecast of future events, a guarantee of future results or investment advice. Views expressed are those of the portfolio manager(s) and may differ from those of other portfolio managers or of the firm as a whole. Also, please note that any discussion of the Fund’s holdings, the Fund’s performance, and the portfolio manager(s) views are as of December 31, 2024 (except as otherwise stated), and are subject to change without notice. Certain information contained in this letter constitutes “forward-looking statements,” which can be identified by the use of forward-looking terminology such as “may,” “will,” “should,” “expect,” “anticipate,” “project,” “estimate,” “intend,” “continue” or “believe,” or the negatives thereof (such as “may not,” “should not,” “are not expected to,” etc.) or other variations thereon or comparable terminology. Due to various risks and uncertainties, actual events or results or the actual performance of any fund may differ materially from those reflected or contemplated in any such forward-looking statement. Current performance results may be lower or higher than performance numbers quoted in certain letters to shareholders. Date of first use of portfolio manager commentary: January 21, 2025 FUND RISKS: In addition to general market conditions, the value of the Fund will be affected by the strength of the real estate markets. Factors that could affect the value of the Fund’s holdings include the following: overbuilding and increased competition, increases in property taxes and operating expenses, declines in the value of real estate, lack of availability of equity and debt financing to refinance maturing debt, vacancies due to economic conditions and tenant bankruptcies, losses due to costs resulting from environmental contamination and its related clean-up, changes in interest rates, changes in zoning laws, casualty or condemnation losses, variations in rental income, changes in neighborhood values, and functional obsolescence and appeal of properties to tenants. The Fund will concentrate its investments in real estate companies and other publicly traded companies whose asset base is primarily real estate. As such, the Fund will be subject to risks similar to those associated with the direct ownership of real estate including those noted above under “Real Estate Risk.” Foreign securities from a particular country or region may be subject to currency fluctuations and controls, or adverse political, social, economic or other developments that are unique to that particular country or region. Therefore, the prices of foreign securities in particular countries or regions may, at times, move in a different direction than those of U.S. securities. Emerging market countries can generally have economic structures that are less diverse and mature, and political systems that are less stable, than those of developed countries, and, as a result, the securities markets of emerging markets countries can be more volatile than more developed markets may be. Recent statements by U.S. securities and accounting regulatory agencies have expressed concern regarding information access and audit quality regarding issuers in China and other emerging market countries, which could present heightened risks associated with investments in these markets. The Adviser’s use of its ESG framework could cause it to perform differently compared to funds that do not have such a policy. The criteria related to this ESG framework may result in the Fund’s forgoing opportunities to buy certain securities when it might otherwise be advantageous to do so, or selling securities for ESG reasons when it might be otherwise disadvantageous for it to do so. For a full disclosure of principal investment risks, please refer to the Fund’s Prospectus. FTSE EPRA Nareit Global ex US Index is designed to track the performance of listed real estate companies and Real Estate Investment Trusts in both developed and emerging markets. By making the index constituents free-float adjusted, liquidity, size and revenue screened, the series is suitable for use as the basis for investment products, such as derivatives and Exchange Traded Funds (ETFs). It is not possible to invest directly in an index. Excess Return refers to the return from an investment above the benchmark. Source: Investopedia Share prices indexed to 100 at 12/31/2021, performance shown in U.S. dollar currency terms 4 Calculated as price to book value for the Hang Seng Properties Index. Source Bloomberg. Small Cap is Equity Market Cap up to US$2bn, Mid Cap US$2bn-US$10bn, Large Cap >US$10bn. Price to Book Ratio: A company’s price-to-book ratio is the company’s current stock price per share divided by its book value per share (BVPS). This shows the market valuation of a company compared to its book value. U.S. Real Estate is Green Streets Market Cap weighted net asset value estimates for their coverage of the U.S. REIT sector. The International Real Estate Index is a composite constructed by TAM. The index takes the regional average weights over the last 15 years. Price to book data is from each regional index. For Japanese REITs, Daiwa Research data is used, and for Japanese real estate companies an average of the three largest companies’ price to book value including unrealized gains is used. Annual average price to funds from operations multiple for BofA research coverage. For the Third Avenue Glossary please visit here. Past performance is no guarantee of future results. |
Original Post
Editor’s Note: The summary bullets for this article were chosen by Seeking Alpha editors.
Editor’s Note: This article discusses one or more securities that do not trade on a major U.S. exchange. Please be aware of the risks associated with these stocks.
Read the full article here


